I would like to formally introduce myself as a data nut. I love AC/DC, tattoos, heavy metal and….data.
What I love about data is (if set up correctly) the numbers don’t lie.
You and I could have a completely different opinion as to whether a marketing campaign will work, yet at the end of the day, neither opinion matters, the data will tell us who (if anyone) is correct.
As the saying goes “the devil is in the detail”.

Our Client
Over the past few months, I have been actively involved in an e-commerce Shopify project for a niche fashion retailer based in the USA.
The company has travelled from strength to strength, becoming a growing brand and future success story. It’s exciting being involved in these projects.
My role has been of implementing tracking and managing Facebook Ads and Google Shopping campaigns.
Whilst myself and my colleague working on the project are happy about the results (sales are up 89% YoY), we both knew results could be improved. The only way to find out how was through in-depth data analysis.
Identifying the issue
The problem for this client was not the traffic, it was the conversions.
We knew (again from data analysis) that the traffic to the site was spot on.
Time spend on the site was solid, bounce rate was low, demographics correct.
The next step was identifying funnel goals.
Were visitors completing any steps in the funnel? If so, where, in the funnel, was the site losing customers?
Patterns are essential
Never make the mistake of dismissing historical data.
For data analysis to be insightful you need to measure long term data and compare YoY / MoM / WoW (tear on year, month on month, week on week).
These comparisons are required to identify any changes to data patterns.
A good example of this is seeing a decrease in conversions related to a drop in traffic after an algorithm update (cue August 2019 where many sites were affected).
If businesses had assumed they were just having a quiet month they would still be in trouble.
Analysing the drop on conversion rates
Traffic has increased YoY, even MoM, and Add to Carts had increased (an average of 7.5% add to cart – still low), yet only 1.98% of add to carts were completing a purchase.
Our next step was to journey through the checkout process ourselves (which we have done time and time again).
Super easy, and, in typical Shopify style, seamless.

So if the checkout process was seamless, why weren’t visitors converting?
Abandon Cart Data
The answer to this had to lay in the Abandon Cart data.
Analysing the Abandon Carts, it soon became apparent that customers were getting as far as adding their address, then leaving.
Now, this is where my interest in psychology and how people think comes into play.
Why would anyone bother to enter their address unless they were interested in having the product shipped? If they were simply “window shopping” (adding to cart but not intending to purchase), why enter an email and a postal address?
Prior to this I had set up funnels in Google Analytics to track each stage of the e-commerce funnel, and could clearly see the exit rate spiked at “Complete Payment”.
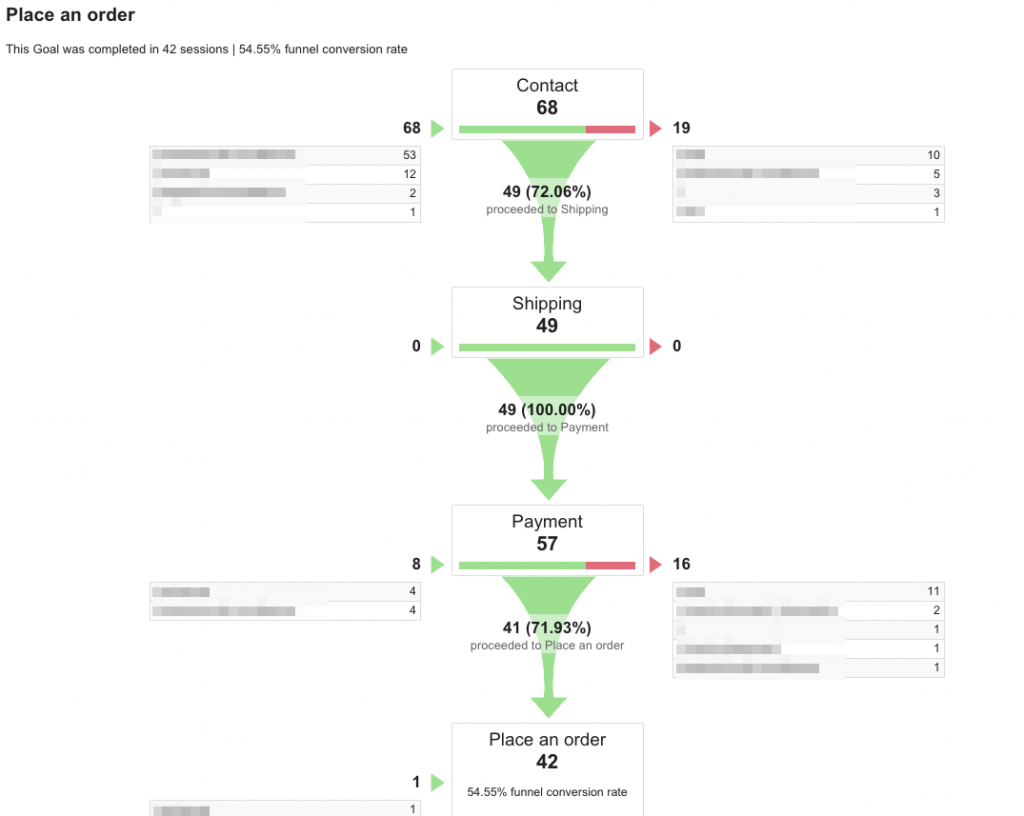
What the data was telling us
The data was telling us this story:
1. Visitors liked the products enough to Add to Cart (not an issue with the product or price)
2. Visitors wanted the products enough to add their email address and postal address (not changing their mind or window shopping)
3. Something stopped the visitor from completing payment.
What was the step, in between adding an address and processing payment that was losing the client? Shipping Rates!
Whilst this may sound straight forward, again the devil is in the detail. The issue was not with every product – only some products which required a custom-sized box – and these caused Shipping Rates to almost double.
Testing was carried out, and the business owners agreed to change the Shipping configurations.
Within 2 days, daily sales increased by 121.2%.
How can you increase your sales quickly?
The best way to consistently increase your e-commerce sales is to ensure you have someone on your team who can analyse data and who understands your target market, product and visitor behaviour.
Not sure where to start? Contact me at Munn Digital for a free 30 minute chat about boosting sales in your e-commerce store.
- Why Have My Rankings Dropped? - July 17, 2020
- Digital Marketing Dos & Don’ts During COVID-19 - April 2, 2020
- Why Is SEO So Expensive - February 6, 2020
